
Included on Free
- Review analytics one week at a time
- See total earnings, cash tips, card tips, and total tips
- View cash-versus-card distribution
- Navigate through all historical data
Income analytics
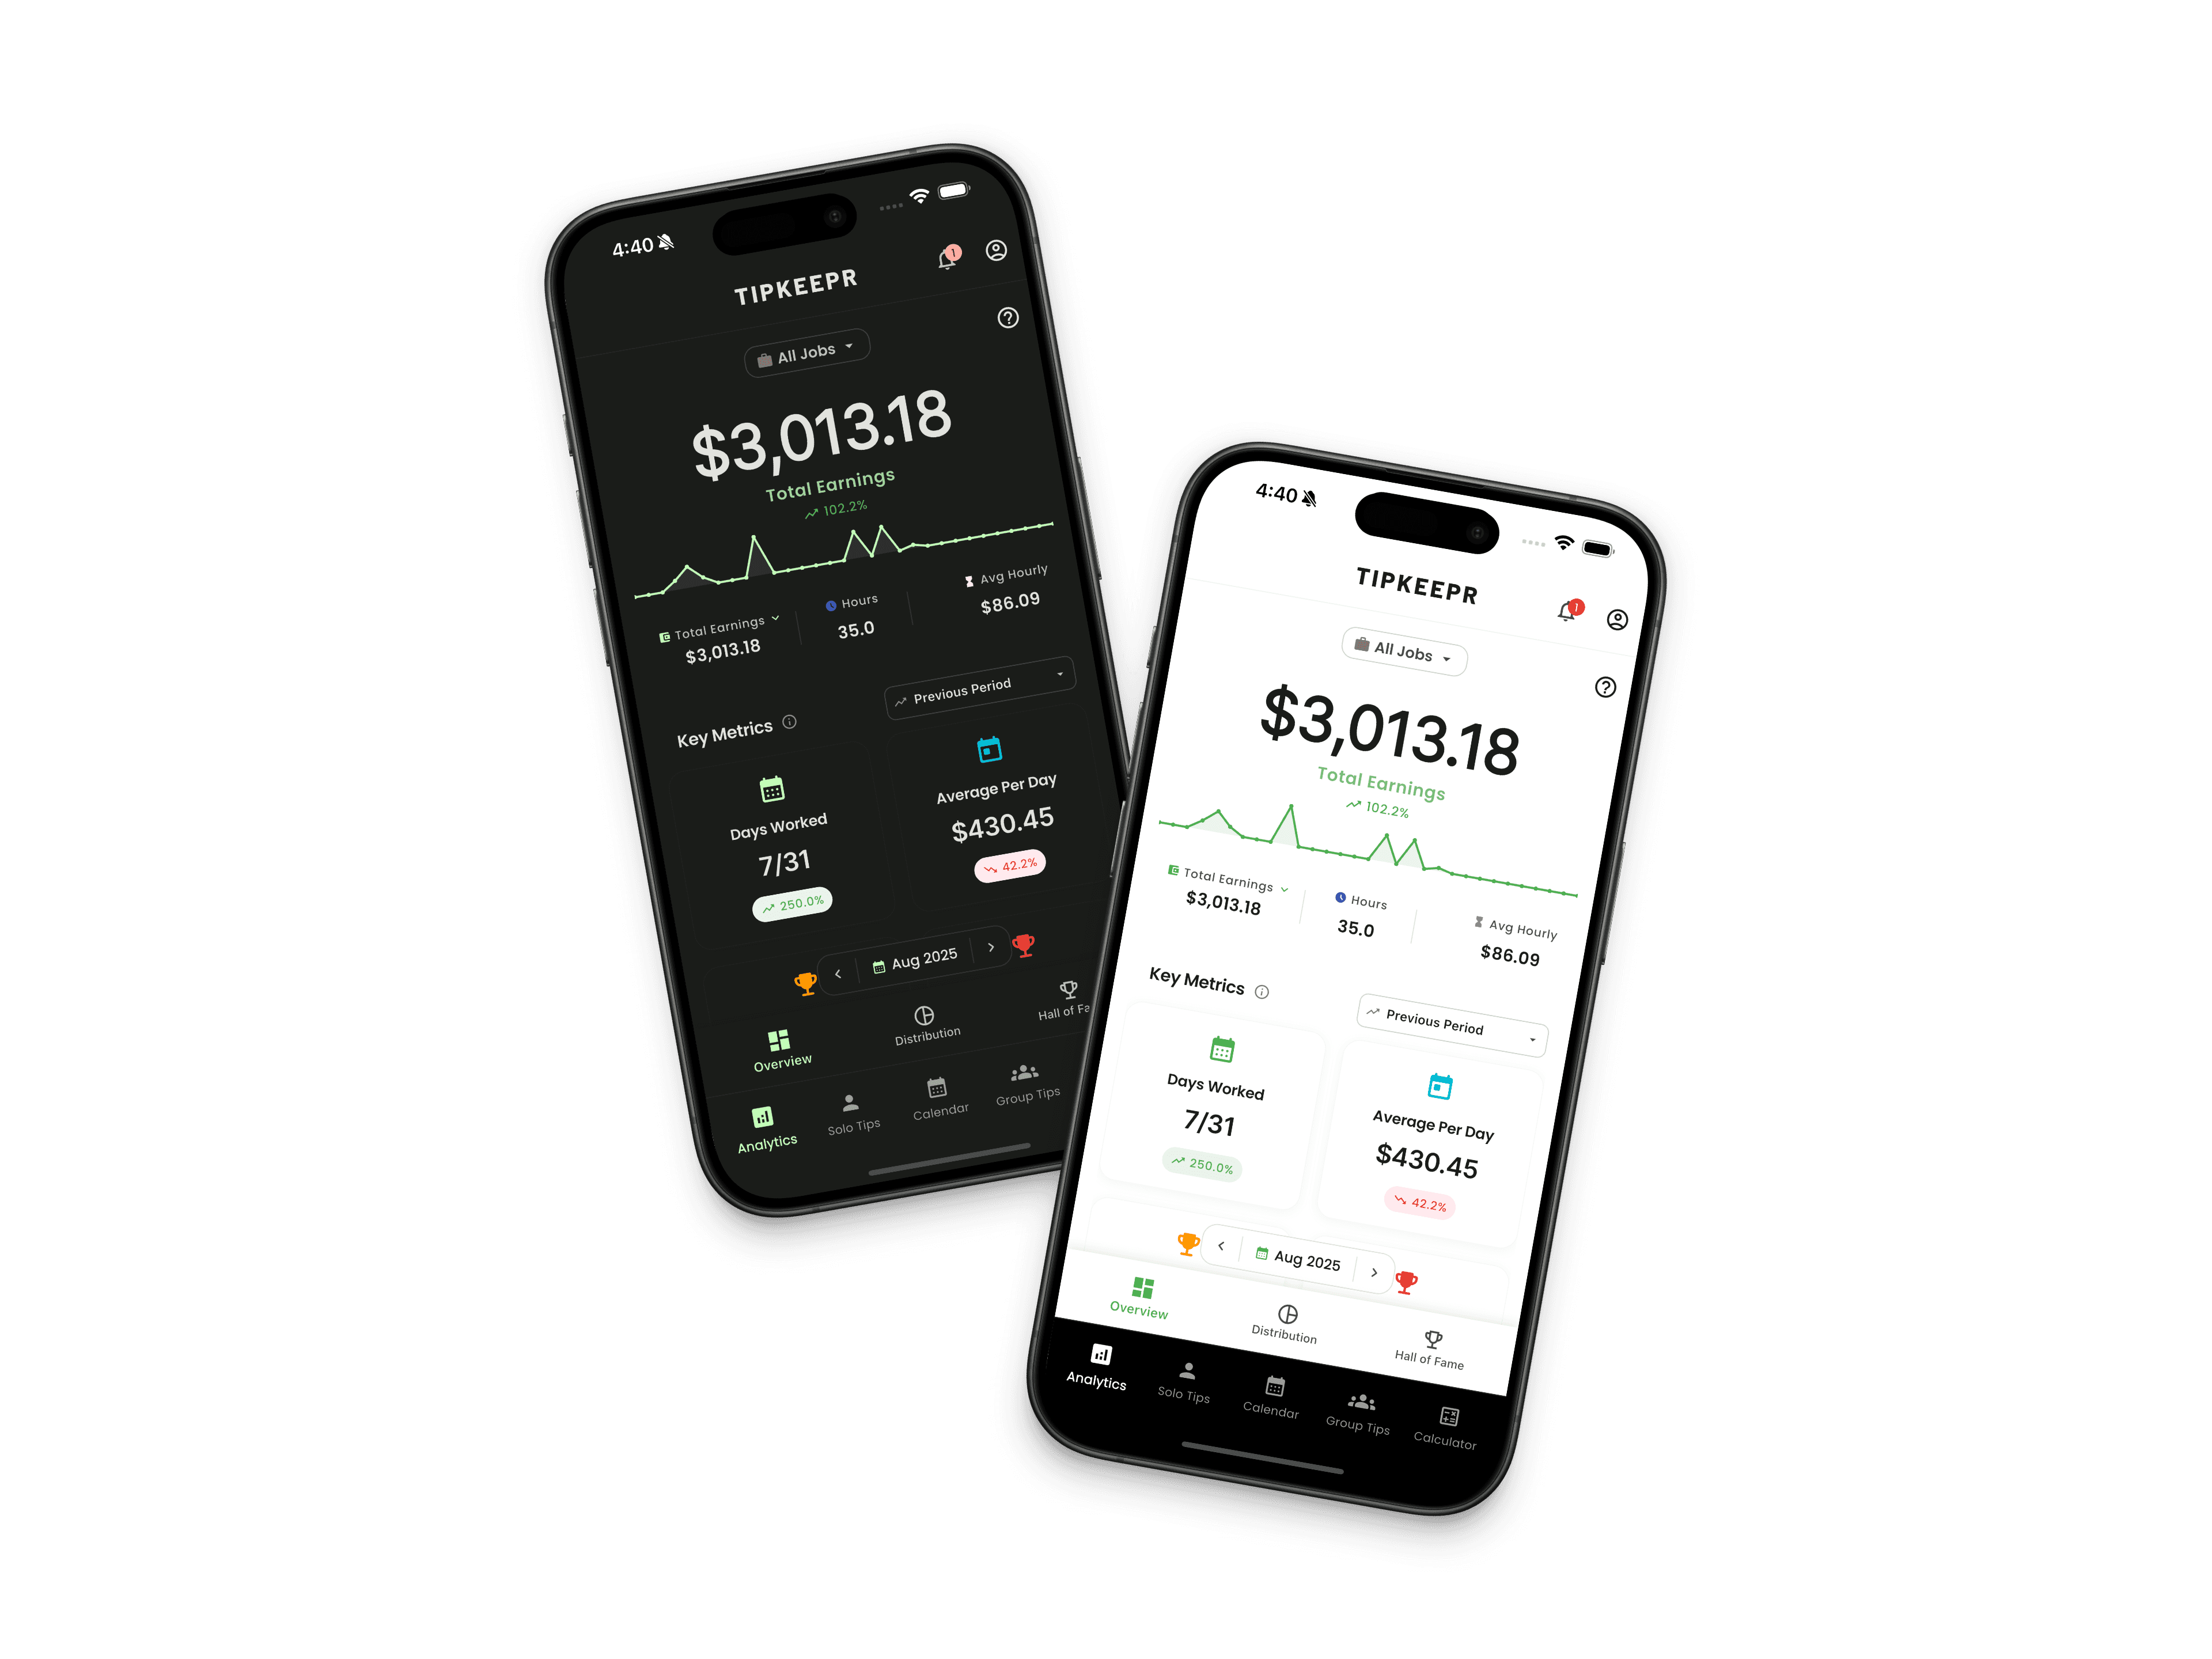
A daily log tells you what happened. Analytics help you see whether certain weeks, jobs, or patterns are changing your earnings. TipKeepr begins with weekly essentials on Free and adds broader ranges and advanced metrics with Premium.
For tipped workers who want to understand their earnings from records they entered themselves, while keeping the difference between basic and advanced analysis clear.
Free is a permanent working plan. Premium adds the tools listed here for $5.39/month or $53.90/year in the US.
Included on Free
Premium adds
Free users keep the same underlying history and can review it week by week. Premium makes longer comparisons faster and reveals additional metrics tied to Premium records such as expenses, payouts, wages, paychecks, and sales.
How it works
Save tips and worked time consistently so the totals reflect the shifts you actually completed.
Check core totals and the cash/card mix, then move backward or forward through your history.
Use Premium ranges and advanced metrics when you need longer comparisons or more detailed income categories.
Weekly review can show how much you earned, how much came from cash versus card tips, and how the period compares with the record you expected. Because the numbers come from your saved entries, missing shifts remain visible as gaps instead of being guessed.
TipKeepr does not claim to forecast future income with AI. The analytics are designed to organize and compare recorded work, leaving you in control of the conclusions.
Premium monthly, quarterly, yearly, and custom ranges reduce the work of paging through weeks when you want a larger view. Multiple job profiles can also keep records separated when you earn tips at more than one workplace.
When you record payouts, expenses, wages, paychecks, and sales with Premium, the analytics can reflect those categories. Take-home tips and deduction-related metrics provide a different view from gross tips alone, while Hall of Fame views surface saved performance milestones.
No. Free retains all historical data and lets you review analytics week by week.
Monthly, quarterly, yearly, and custom analytics ranges are Premium. Weekly viewing is included on Free.
No. TipKeepr organizes and compares the income records you enter; it does not offer AI earnings forecasting.