
Analytics
How TipKeepr income analytics work
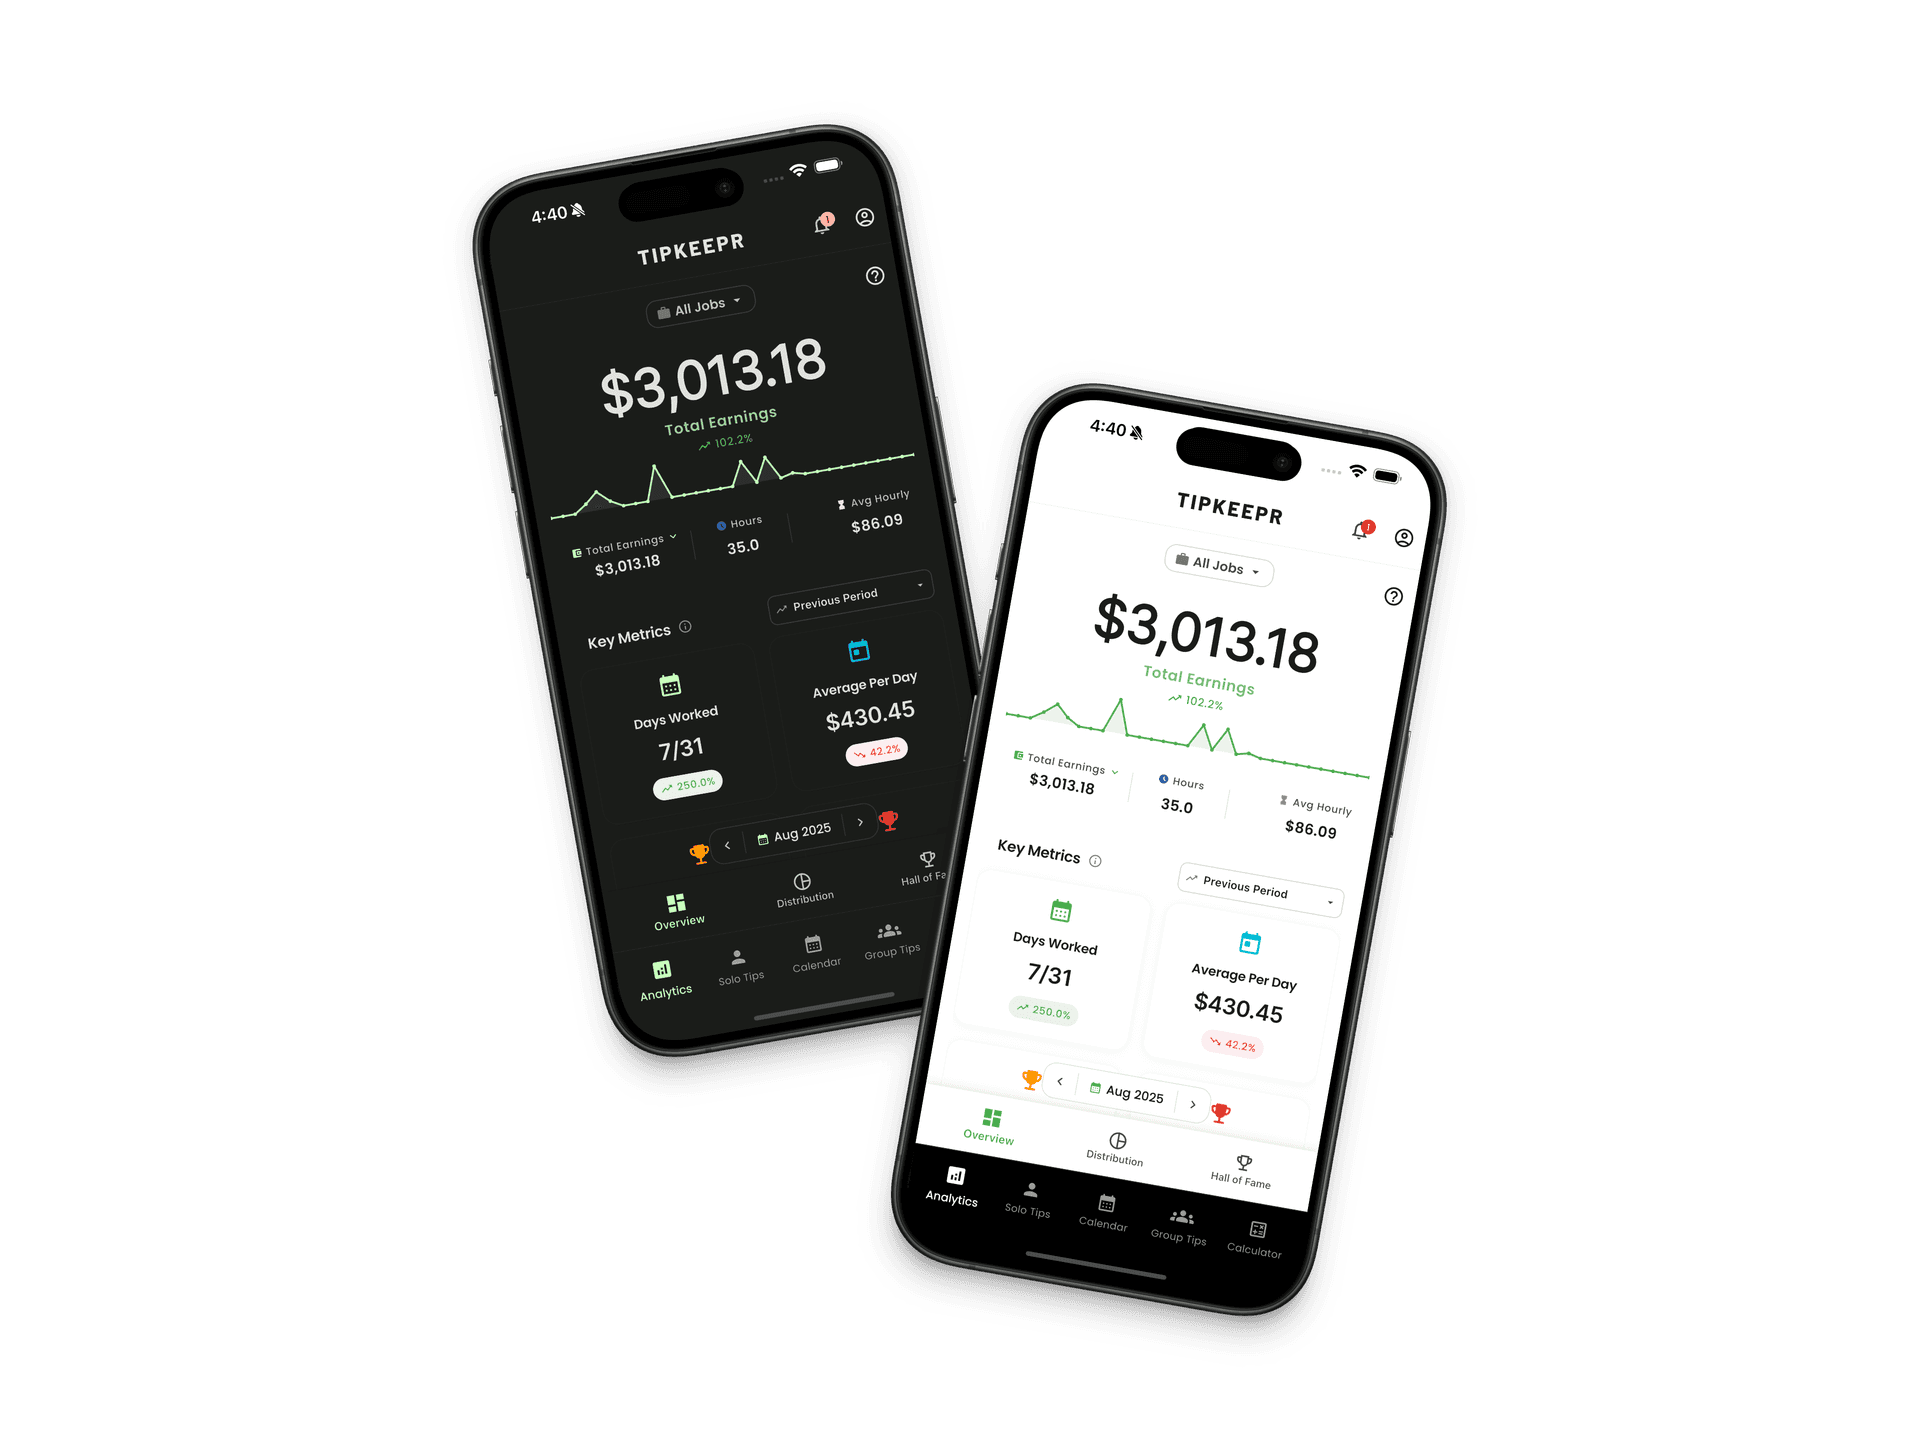
Analytics summarize the entries you have recorded. TipKeepr Free keeps all of your history and lets you review it week by week; Premium adds longer ranges and more detailed metrics.
6 min read
Step by step
- 1
Choose the job context
Use the available job selection to focus the view when your plan and records include more than one job.
- 2
Review the date range
Free uses weekly navigation. Premium adds monthly, quarterly, yearly, and custom ranges.
- 3
Read the totals
Start with total earnings, cash tips, card tips, total tips, and the cash/card distribution.
- 4
Open deeper Premium metrics
Premium records can add payouts, expenses, take-home tips, wages, paychecks, sales metrics, and performance views.
Free history is not limited to 30 days
The weekly control changes how much is displayed at one time. It does not delete or hide older entries permanently. Move backward through prior weeks or open older dates from the calendar.
Analytics depend on complete entries
The charts and totals reflect the records saved in the app. If a shift is missing or an amount was estimated, the summary will reflect that input. TipKeepr does not generate AI earnings forecasts or replace missing work records with predictions.